
In just a few short weeks, fourth year medical students will enter arguably the most important period in their careers -- the residency application process. This can be an overwhelming and expensive process, fraught with dozens of factors to consider. In an average year, each medical student applies to 36 programs, travels to 12.3 interviews, and pays as much as $7,000 on travel and fees. All told, this process piles on another $100 million in medical student debt per year.
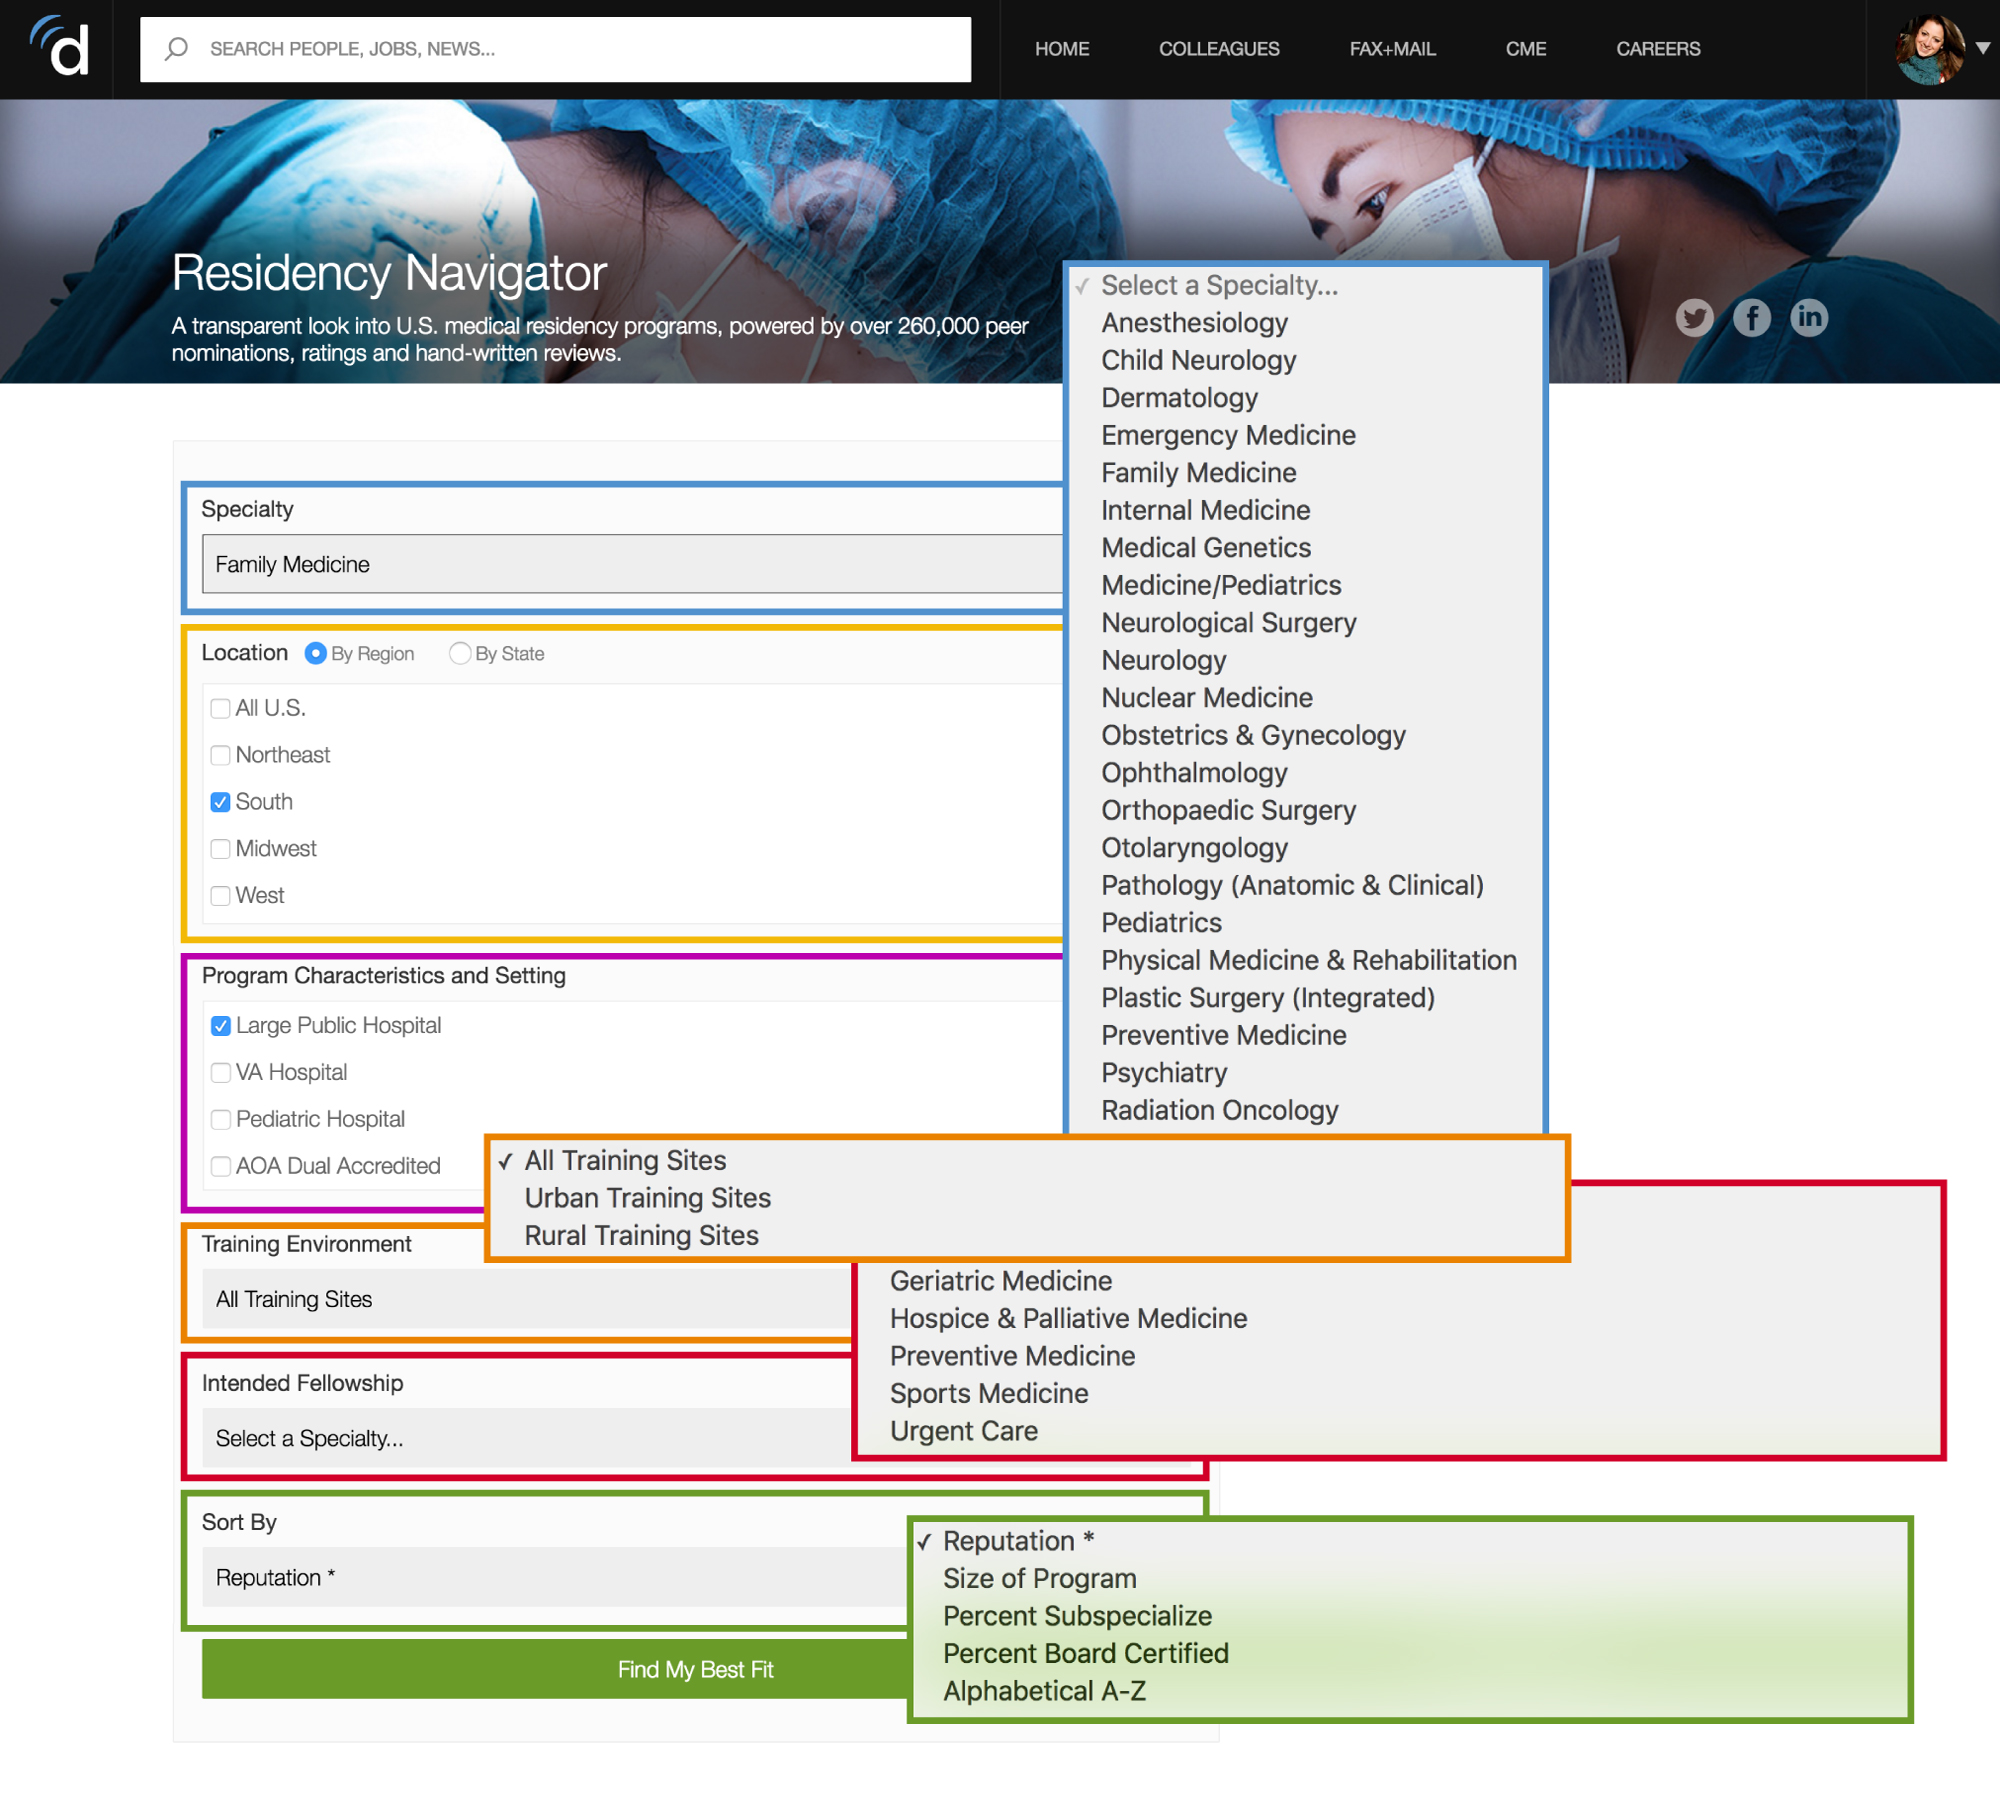
To help medical students in their quest to find the right residency program, Doximity is pleased to release the 2016-2017 Residency Navigator, a comprehensive guide to over 4,000 residency programs across 27 specialties. Along with objective data, program pages include 260,000 nominations, ratings and reviews from 52,000 U.S. physicians, giving medical students an insider look of what resident life is like at that program. Residency Navigator is built around personalized search filters, allowing students to customize their searches based on the factors most important to them, including geography, practice setting, clinical reputation, and alumni “outcomes” measurements of board certification, subspecialization and research output.
What are medical students searching?
We analyzed students’ searches over the past year and discovered a few trends.
Specialty searches
Orthopedic surgery was by far the most disproportionately explored specialty (relative to the total number of applicants in 2015*). Perhaps this is an indication that orthopedic surgery applicants are conducting more thorough research because of the specialty’s competitive nature. We asked orthopedic surgeon and sports medicine specialist Jerome Enad, MD to explain the specialty’s appeal:
“Orthopedics provides an enjoyable and stimulating specialty to medical students. Most of us can see ourselves in the role of an orthopedic patient - shoulder sprain, knee injury, low back pain, etc. Thus it is professionally rewarding to use our training and expert knowledge to diagnose and treat these common conditions. The specialty of Orthopedics allows us to provide both non-surgical and surgical treatment options to help our patients. Therefore we act as advisors as well as technicians. It can be mentally challenging to find the right treatment option, but our results are usually definite and satisfying.”
Otolaryngology beat out urology by a nose for the second most searched specialty (sorry, we couldn’t resist).
Location searches
One of the most-used search features of Residency Navigator is to discover programs by geography. Med students seem to have set their sights on major coastal states.
Most popular region
- Northeast
Most popular states
- New York
- California
- Illinois
- Texas
- Florida
Residents who train together, stay together... right?
Residency is an intense time in a physician’s life, so the bonds between co-residents are often strong. In fact, 60% of co-authors who trained together first did so in residency. So when residency wraps and it’s time to plant roots, it can be a shock when their colleagues move away.
With this in mind, we examined which states are lucky enough to keep the residents who trained in those states 2-12 years post-residency. It turns out, there’s big love for the Big Sky Country, whereas physicians trained in D.C. perhaps “Don’t Connect” enough to stick around longer.
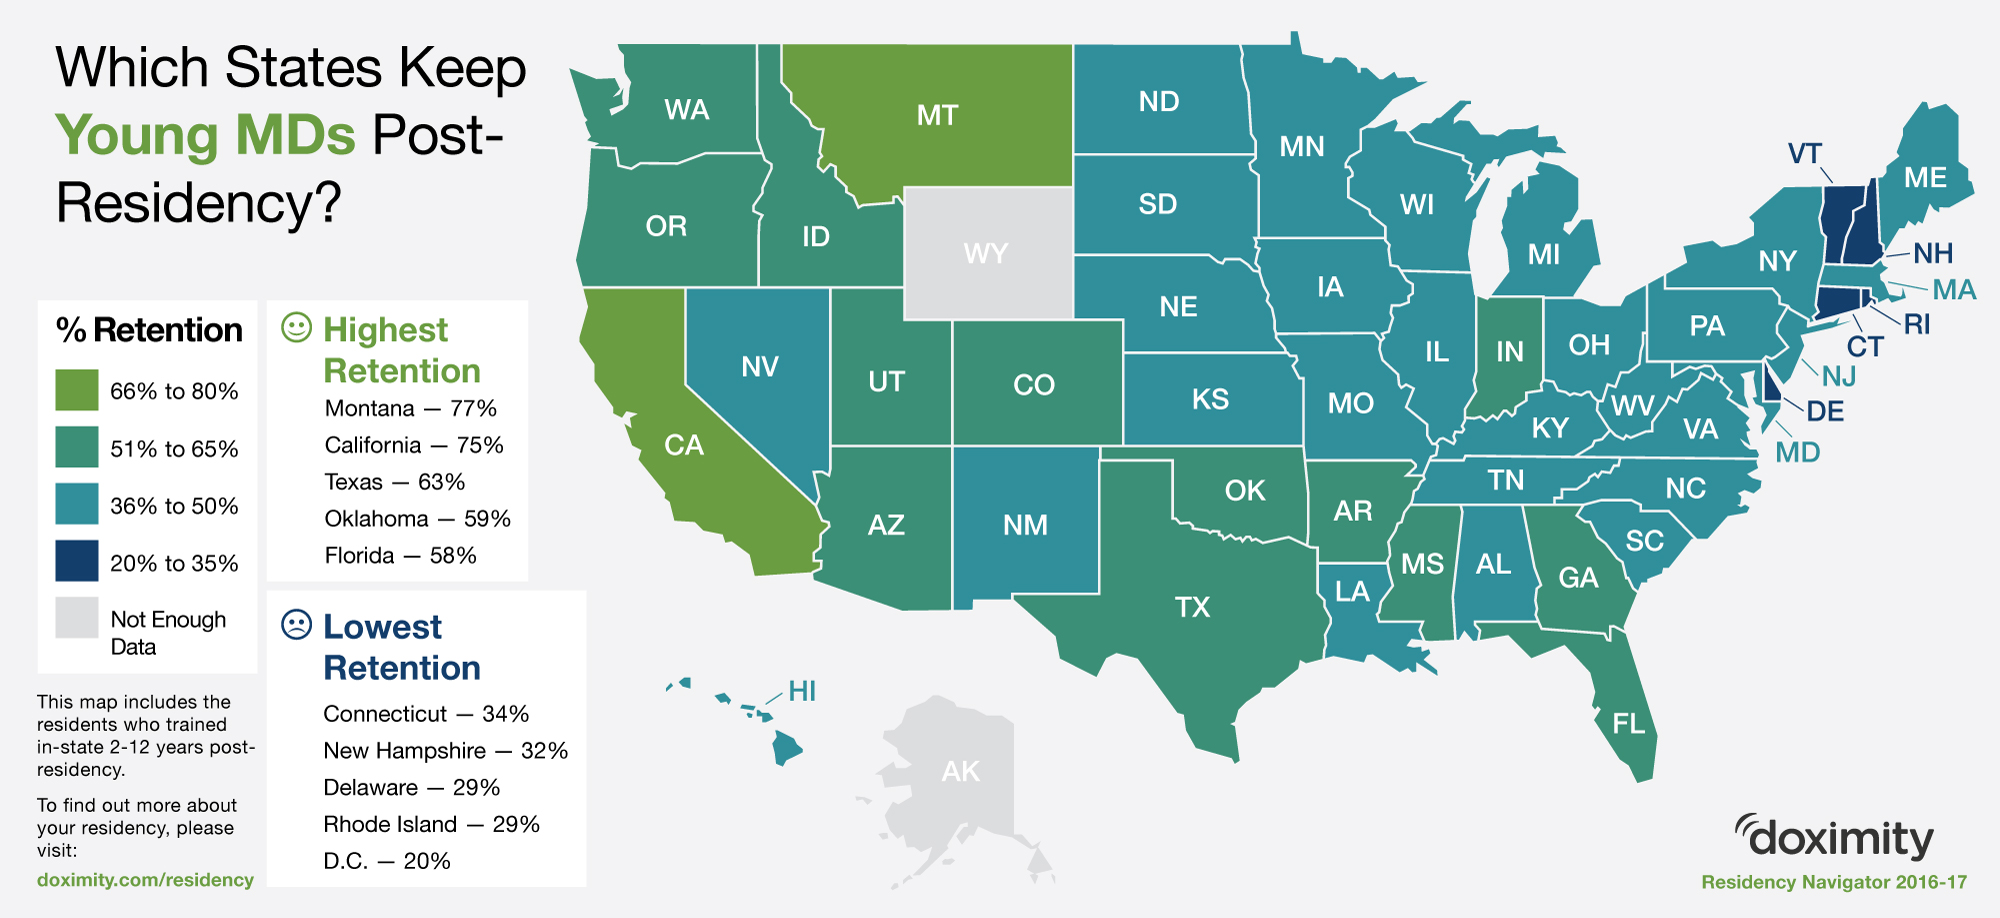
States with the highest post-residency physician retention rate
- Montana (77%)
- California (75%)
- Texas (63%)
- Oklahoma (59&)
- Florida (58%)
States with the lowest post-residency physician retention rate
- Connecticut (34%)
- New Hampshire (32%)
- Delaware (29%)
- Rhode Island (29%)
- D.C. (20%)
Which specialties plant their roots in residency vs. cut and run?
Child neurologists, family physicians and pediatricians are among the top five specialists that stayed in-state post-training. Perhaps their bonds with families in the community grow deep while in residency, making it harder to relocate, or perhaps these specialties are most supportive of starting one’s own family.
On the other hand, surgeons are more eager to ship their scalpels across state lines. This could be due to limited available positions for specialized surgeons in some regions.
State-loyal specialties
- Child neurology (61% of physicians trained in-state, stayed in-state)
- Family Medicine (59%)
- Psychiatry (58%)
- Pediatrics (56%)
- Oral & Maxillofacial Surgery (55.7%)
Specialties that say sayonara
- Thoracic Surgery (72% of physician trainees leave state)
- Colon & Rectal Surgery (70%)
- Plastic Surgery (67%)
- Vascular Surgery (66%)
- Ophthalmology (65%)
Happiness
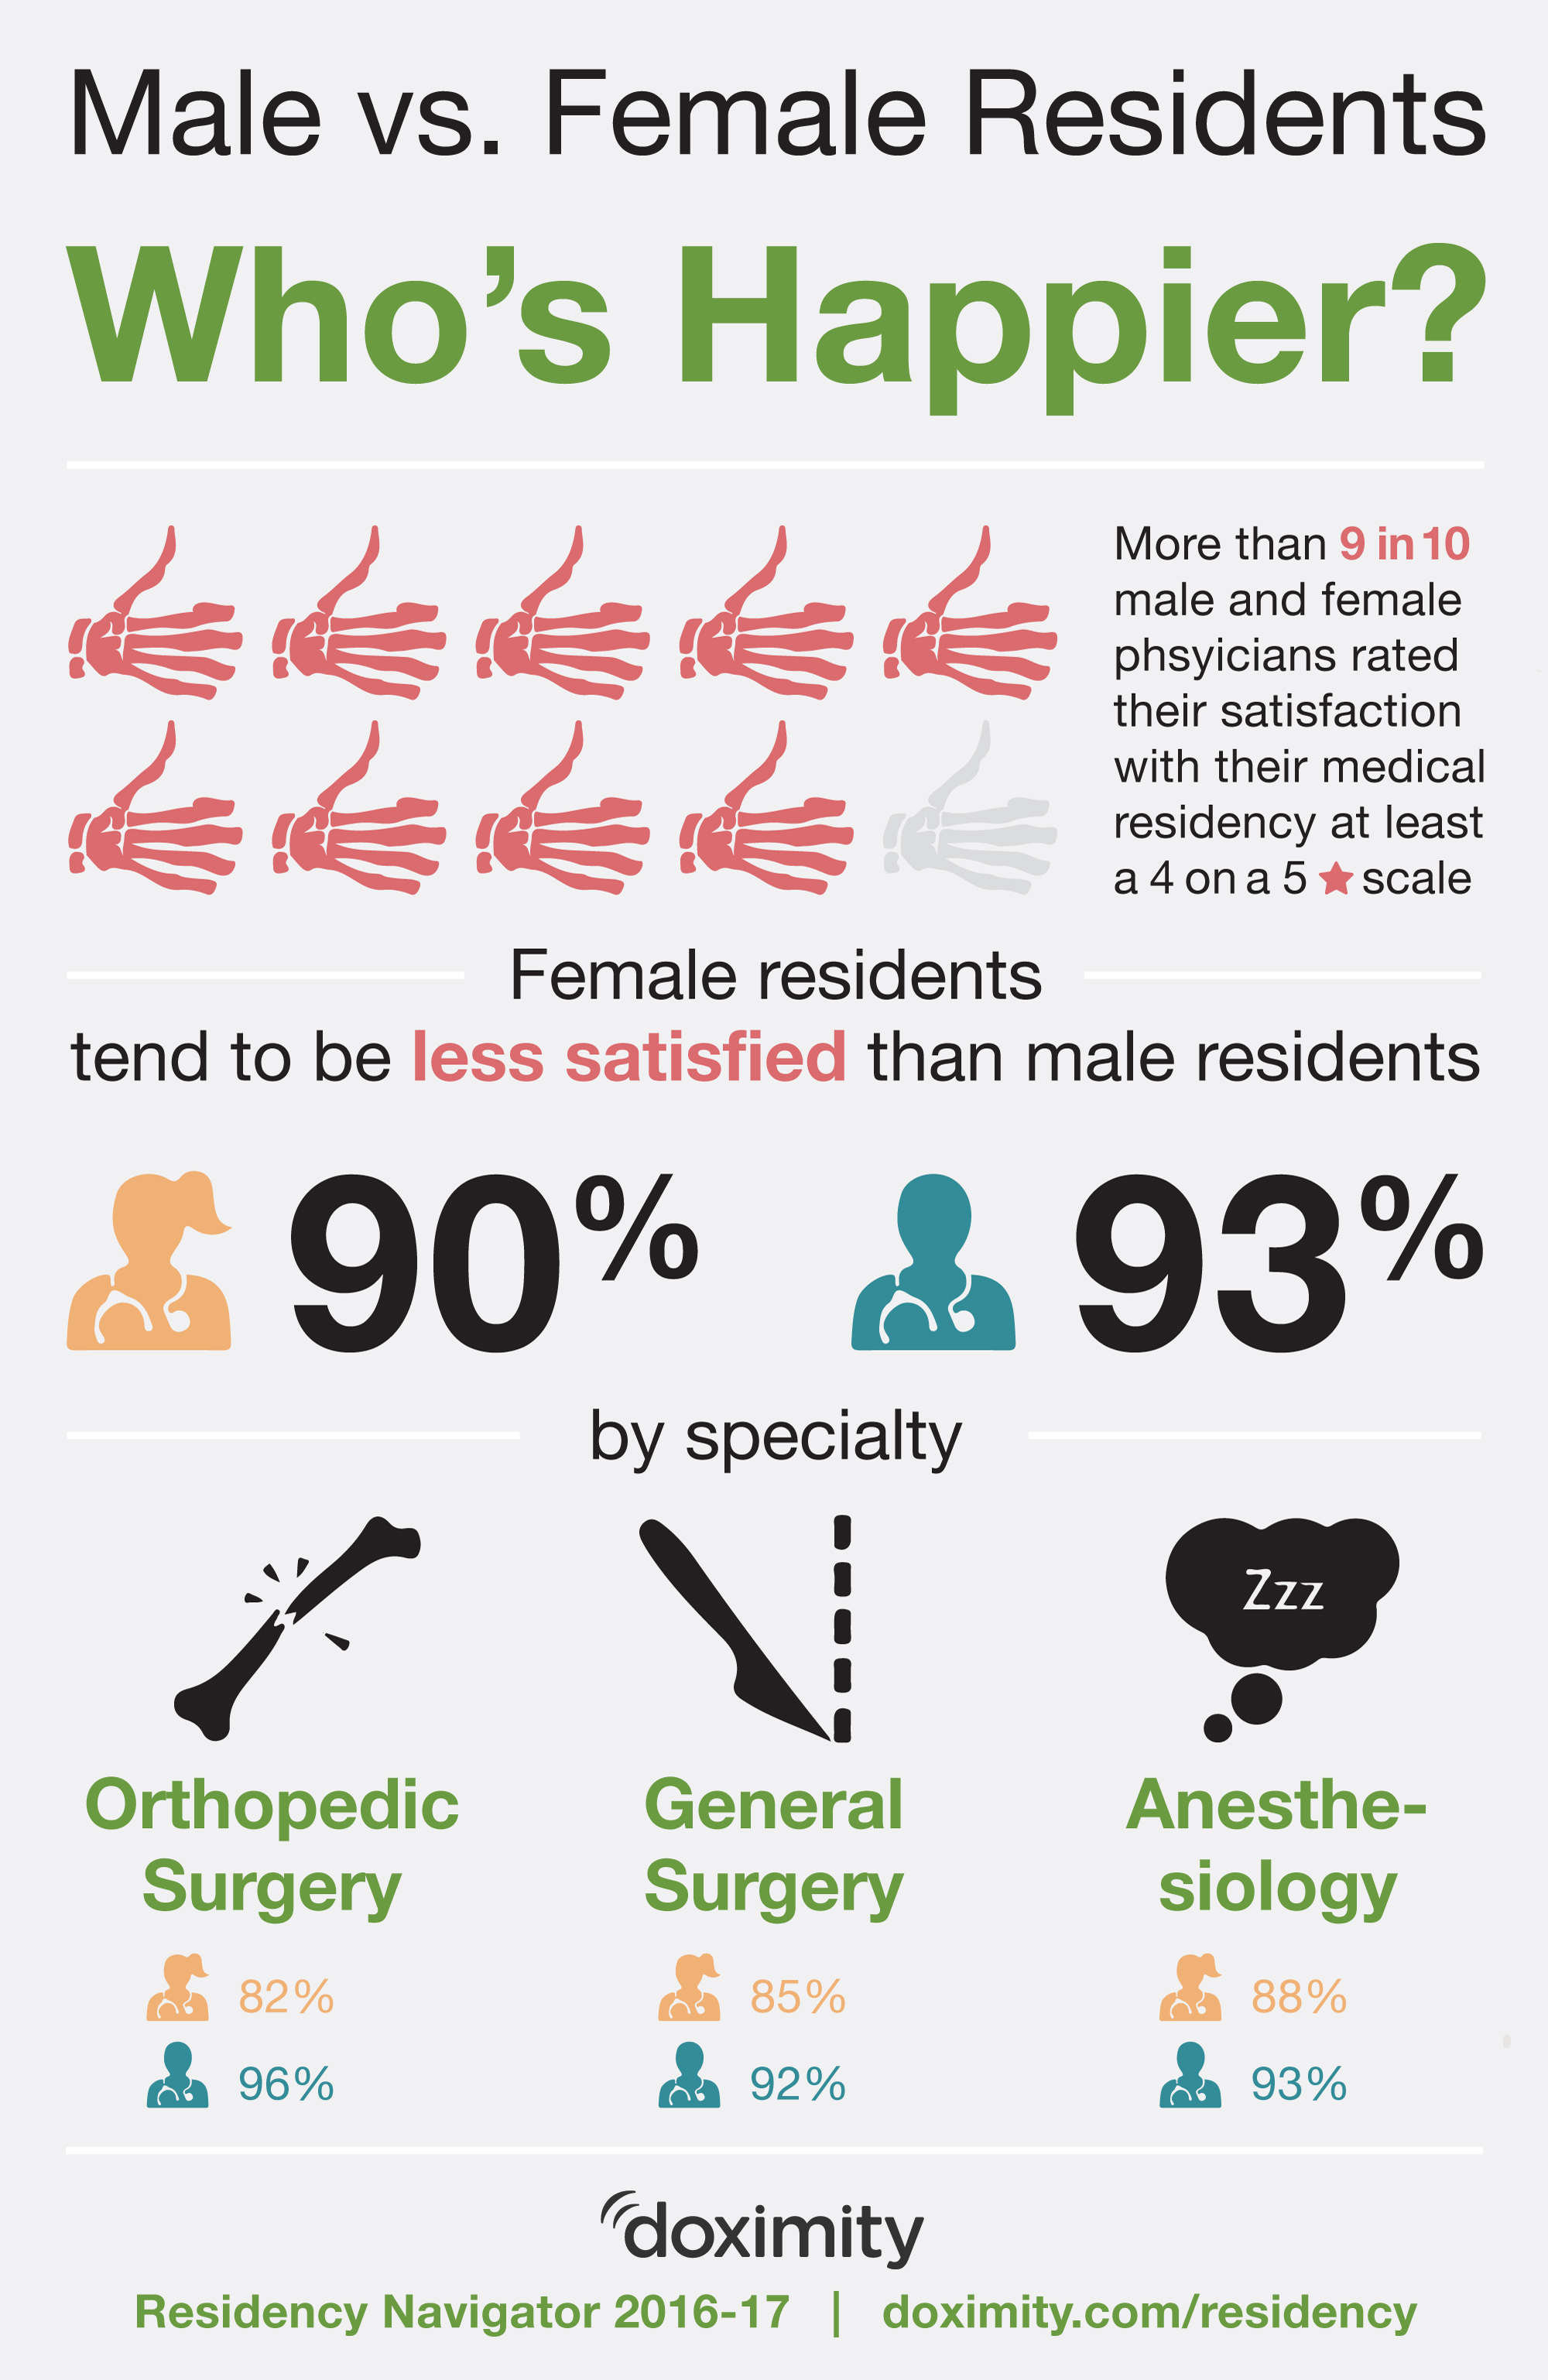
Satisfaction with one’s residency experience derives from a number of variables, including but not limited to culture and people, training environment and geography. We asked current and recent alumni across the country for an “overall rating: willingness to recommend this program to others.” For this analysis, physicians who rated their programs at least 4 out of 5 stars on this gestalt satisfaction metric were considered to be “happy.”
By Geography
Like last year, residents who trained in Oregon, Vermont, Minnesota and North Carolina were among the most satisfied with their programs. Residents in Idaho, however, would be the most likely to recommend their training programs. Apparently Idaho is a pretty “apeeling” place to train. How do you like them potatoes?
Happiest States
- Idaho (100%)
- Vermont (98.3%)
- Oregon (97.7%)
- Minnesota & North Carolina (96.2%)
- Utah (95.7%)
Unhappiest States
- Oklahoma (84.6%)
- Nebraska (83.7%)
- Mississippi (82.8%)
- Nevada (77.8%)
- South Dakota (76.2%)
For some states, overall satisfaction varied between those who had trained as specialists versus in primary care. For example, specialists who trained in West Virginia were unanimously satisfied with their programs (100%, at the time of this publication), but primary care physicians were much less satisfied, placing the state in the bottom five on the satisfaction scale (84%).
By Gender
As we saw last year, female residents tend to be somewhat less satisfied than male residents (M = 93%, F = 90%), and the gender gap widens in some historically male-dominated specialties. Orthopedic surgery, for example, has the largest satisfaction divide (82 percent for women vs. 96 percent for men ; p<0.01), followed by surgery (85 percent vs. 92 percent; p< 0.01) and anesthesiology (88 percent and 93 percent; p<0.01). However, female Physical Medicine & Rehabilitation residents are more satisfied than male residents (94 percent vs. 92 percent).
Gender Balance*
Historically, medicine has been a male dominated industry, however in recent years there has been a growing number of females entering the field. According to the AAMC, 47 percent of current medical students and 46 percent of residents are women.
The gender divide, by state
- Who runs Delaware? Girls. (Or rather female residents.) Delaware has the largest number of female residents -- there are 14% more female residents than male. Other female dominant states include: Idaho and Oregon.
- Where does M.D. stand for “Male Dominant”? Mississippi. For every female resident, there are almost 2 male residents. A significant imbalance also exists in Oklahoma and Minnesota.
Most gender balanced states
- South Dakota
- Washington, D.C.
- Rhode Island
- Maine
- North Dakota
* Based on Doximity profiles of current and recent program alumni
Doctors know best
We’d like to thank our Doximity members for sharing their training experiences to help the next generation of physicians find the right program fit. It’s an inspirational example of what the world’s largest body of physicians can achieve together.
Visit Residency Navigator: https://residency.doximity.com/