
By Joel Davis, VP of Hiring Solutions at Doximity
Last year we unveiled Career Navigator, the first-ever comprehensive career resource that includes physician compensation estimates and open job opportunities. Now, more than 35,000 Doximity members have anonymously shared their annual income with the greater physician community in an effort to bring more transparency to medical careers. For some, this insight has helped them better prepare for career moves and salary negotiations.
Sports medicine physician Dr. Rowan Paul said, “when I was negotiating for partnership, I used Doximity and had more confidence negotiating a very competitive compensation package.”
Others have discovered new opportunities -- either full-time clinical positions, or to supplement their current practice. For example, 50% of all physicians practicing in American Well’s telehealth group discovered the opportunity through Doximity.
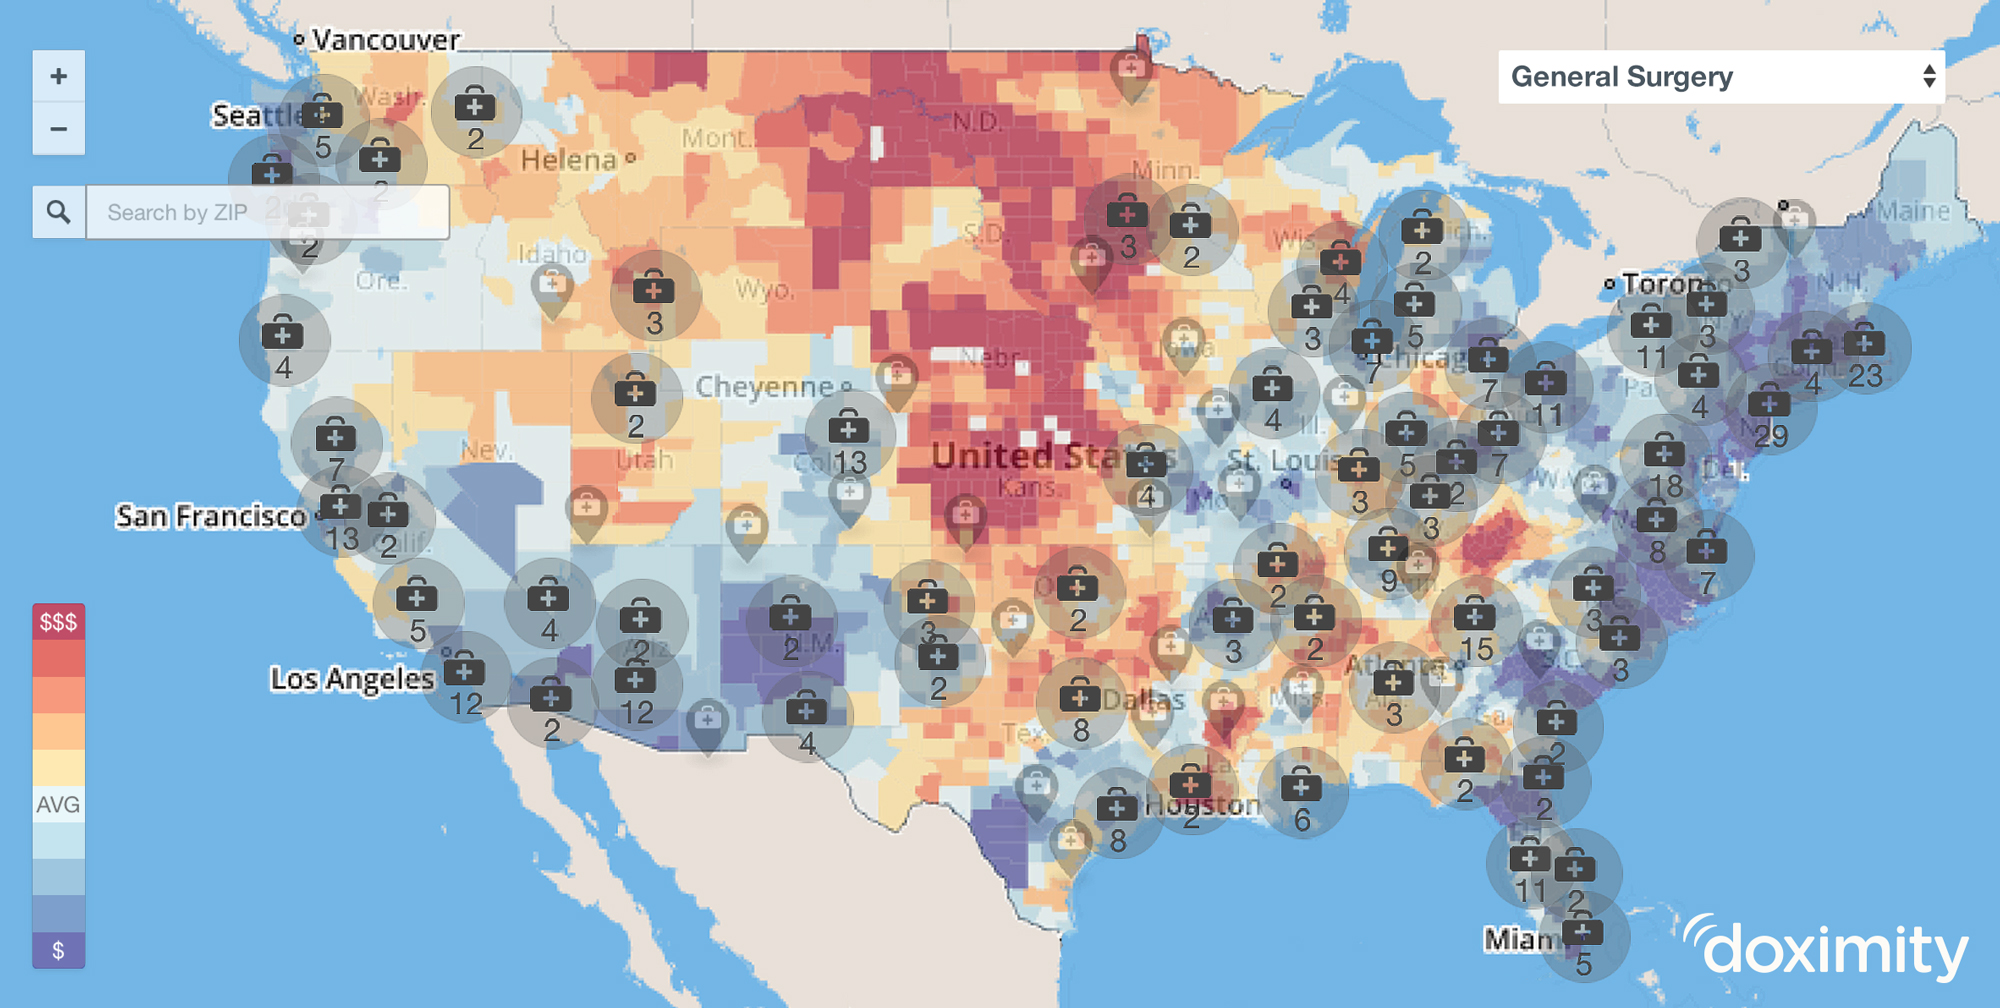
General Surgery jobs and physician compensation survey map. Physicians can access all maps at www.doximity.com/careers.
As physicians finalize their resolutions for the new year and plan the next steps for their careers, we want to share the latest insights our data scientists have gleaned from our compensation map. In this latest round of analysis we examined the balances (or imbalances) between locations, academic versus clinical positions, and genders.
LOCATION, LOCATION, LOCATION
If you are looking for the maximum return on your extra decade of education, then where you practice matters. It turns out, cities where our data shows physicians are most interested in working — Los Angeles, San Francisco and Washington, D.C. — have average salaries significantly lower than the rest of the country. Physicians living in our nation’s capital, for example, had the lowest average salary across all specialties — making a full 17% less than the national average for all specialties.
Doctors in these metropolitan areas are most in-demand by employers based on recruitment activity on Doximity:
1. Denver, Colorado
2. Louisville, Kentucky
3. Spokane, Washington
4. Las Vegas, Nevada
5. Colorado Springs, Colorado
When it comes to average annual income, Minnesota and Indiana seem to fare the best -- both are 13% over national average for all specialties. So, if you really want get the most return on your medical school investment, head to the heartland.
Highest paying states for primary care physicians (family medicine, internal medicine, pediatrics, OB/GYN):
1. Arkansas - $330,000
2. South Dakota - $305,000
3. Iowa - $305,000
Lowest paying states for primary care physicians (family medicine, internal medicine, pediatrics, OB/GYN):
49. Delaware - $218,000
50. West Virginia - $205,000
51. District of Columbia - $192,000
Highest paying states for specialists:
1. North Dakota - $472,000
2. Wyoming - $433,000
3. Idaho - $429,000
Lowest paying states for specialists:
49. Vermont - $299,000
50. District of Columbia - $298,000
51. Rhode Island - $291,000
PHYSICIANS IN ACADEMIC MEDICINE PAY THE PRICE
Academic medicine has always been one of the most important callings in healthcare. Not only do these physicians continue to mold the future of medicine with each class, but the with the impending physician shortage, they are responsible for making sure their cohorts are prepared to carry the growing caseload. And we have academic physicians to thank for making great strides in medical research.
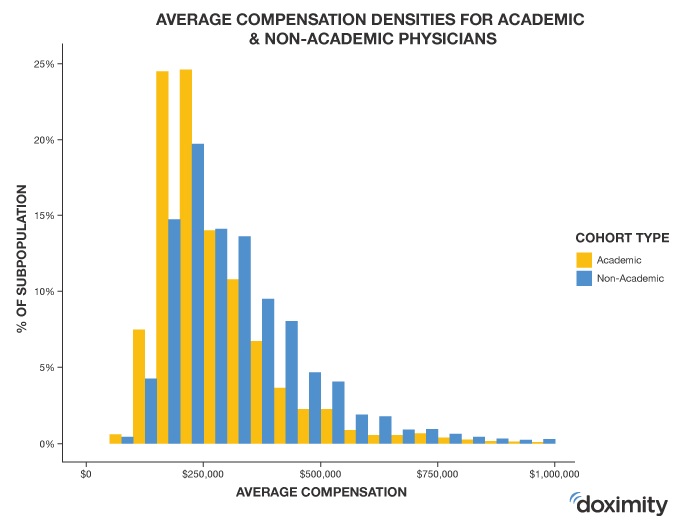
However, devotion to teaching and research comes at a price. As a whole, academic physicians make on average 13% less than their non-academic counterparts, and this varies significantly by specialty. For example, academic cardiologists make on average 52% (or $150,000; p < .05 ) less than their non-academic counterpoints. Similarly, non-academic gastroenterologists make 41% (or $124,000; p < .05) more than academics in the specialty. Similar to the pay gap findings in gender, the procedural specialties tend to make significantly more in non-academic careers.
Additionally, while we don’t account for tenure or geography, it appears that academic physician earnings cluster around $250,000 and have less variability:
MALE VS. FEMALE PHYSICIANS: IS THERE PAY GAP?
Women now make up 34% of the physician workforce and half of this year’s medical school graduating class, yet inequalities persist in their careers. In September 2015, a study by Dr. Anupam Jena revealed women in academic medicine were 13 percent less likely to be promoted to full professor than men with the same qualifications. Another study suggested women are less likely to get research funding. Our data tells a similar story: overall, male physicians tend to make an average of 21% more than female.
Specialties with some of the largest gender pay gaps:
- Ophthalmology: males earn 36% more than their female counterparts (~$95,000 more per year; p < .05)
- Physical Medicine & Rehabilitation: males earn 24% more than females (~$80,000 more; p < .05)
- Cardiology: males earn 29% more than female cardiologists (~$97,000 more; p < .05)
Specialties with some of the smallest gender pay gaps:
- Anesthesiology: males earn 12% more than female anesthesiologists (~$43,000 more; p < .05)
- Radiology: males earn 13% more than females (~$49,000 more; p < .05)
- Family Medicine: males earn 14% more than females (~$30,000 more; p < .05)
*This analysis does not account for any disproportionate subspecialization (e.g. more men pursuing a higher paying subspecialty such as interventional cardiology).
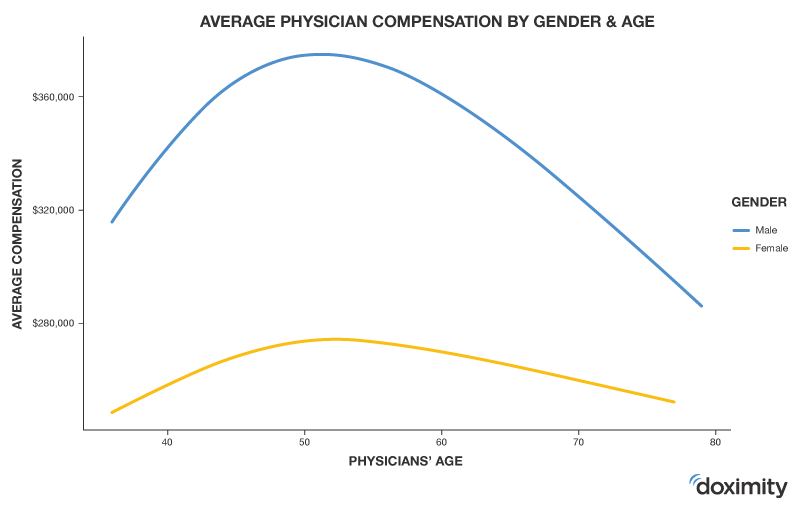
At what point in their careers are men and women equally compensated?
The difference in earnings between men and women seems to persist across the career timeline -- the gap closing only slightly as physicians approach retirement.
While there are movements in the industry to close the gender gap in both academic and non-academic careers, the gender pay gap remains an issue.
*For other Doximity gender studies, check out blog posts about resident happiness and women surgeons using social networking.
BRINGING TRANSPARENCY TO PHYSICIAN CAREERS
Compensation is nowhere near the primary motivating factor for many in medicine. However, the employment landscape is shifting: more physicians are selling their private practices to become employees of hospitals and large groups. Therefore, it is important that physicians prepare for salary negotiations. We hope that by adding a bit of transparency to compensation trends with Career Navigator and pairing it with job opportunities in areas with unmet needs, physicians will be empowered to take control of their careers and get compensated fairly for keeping the country healthy.
Physicians can explore the interactive compensation map at www.doximity.com/careers.
**Note: all salary estimates are based on self-reported annual income, not per unit of work. They were not controlled for part time vs full time work. Other than the academic vs. non-academic comparison, all figures include both academic vs. non-academic salaries. Gender pay by specialty is not weighted by subspecialty.